Numerical results from various data analysis, such as Roughness and Particle and Pore Analysis are shown in a result pane including grids. The data in the grids can be organized and saved to the clipboard as described below:
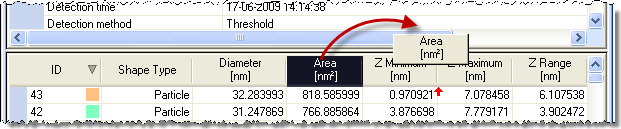
Column positions can be interchanged by dragging the header of a column with the mouse, and column widths can be adjusted by dragging the borderline between headers. A fast click on a header will sort the spreadsheet according to that column in ascending order. Yet another click will reverse the sorting. For Particle and Pore Analysis the default sorting is by the ID number.
Various copy functions are available in a context menu which is activated by clicking the right mouse button on the selection or cell of interest.
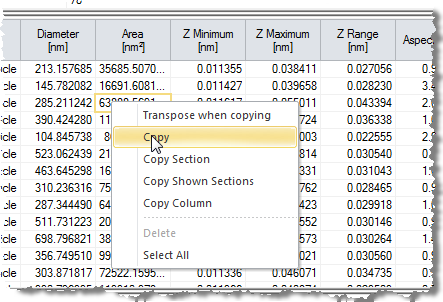
Transpose When Copying: This toggle causes the copied selection or section(s) to be transposes so that columns becomes rows, which may be desired in case there is only very few rows.
Copy <Ctrl+C>: Will copy the current selection to the clipboard. It is not possible to select across sections.
Copy Column: Will copy the column, which was clicked on in that section. When used in the Results or Statistics sections the Column Name will also be copied.
Copy Section: Copies the section clicked upon, including labels (for the Results section and Statistics section). If you want to copy an entire section without Header Names, use Select All followed by Copy.
Copy Shown Sections: Copies the contents of the all shown sections of the Shape Measurements pane to the clipboard.
Select All <Ctrl+A>: Selects all cells in the current section.